Loading… Book a free consultation

Profitability Analysis for Small Businesses: Revenue Does Not Equal Profit

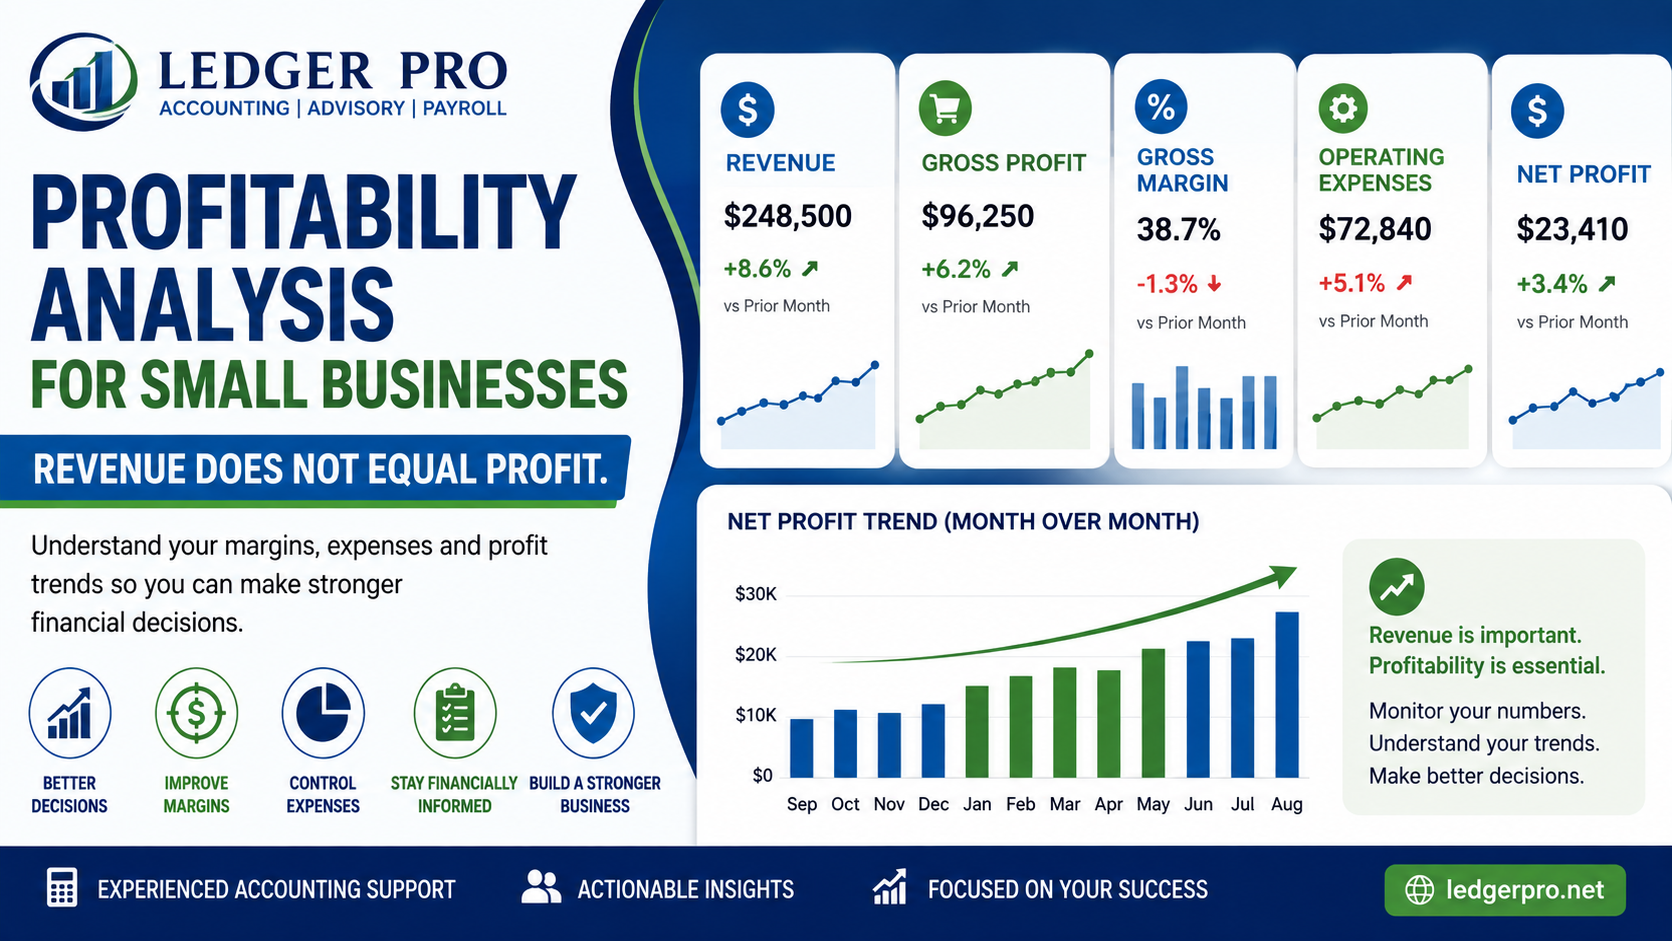
Strong sales do not always mean strong profits. A business can increase revenue while margins decline, expenses rise or cash becomes tighter. Profitability analysis helps you understand how much of your revenue is being converted into gross profit and net income.

Ledger Pro combines accurate accounting records with practical financial analysis to help business owners understand margins, cost trends and overall financial performance.

Revenue shows activity. Profit shows performance. A growing business still needs to monitor margins, expenses and operating efficiency to understand whether growth is improving financial results.

What Is Small Business Profitability Analysis?

Small business profitability analysis examines the relationship between revenue, direct costs, operating expenses and net income. The goal is to understand where profit is being generated, where it is being reduced and whether financial performance is improving over time.

For broader financial decision support, see Ledger Pro small business advisory services.

Why Profitability Analysis Matters

  • Understand whether revenue growth is producing higher profit.
  • Monitor gross profit and gross margin.
  • Identify rising operating expenses.
  • Compare profitability across periods.
  • Spot products, services or activities with weak margins.
  • Evaluate whether pricing supports your cost structure.
  • Support better budgeting and planning decisions.

Start With the Profit and Loss Statement

The Profit and Loss Statement is the primary report for profitability analysis. It shows revenue, cost of goods sold or direct costs, gross profit, operating expenses and net income for the selected period.

  • Total revenue.
  • Cost of goods sold or direct costs.
  • Gross profit.
  • Gross profit margin.
  • Payroll and labor costs.
  • Operating expenses.
  • Net income or loss.

For a broader monthly review process, see Monthly Financial Review for Small Business.

Gross Profit and Gross Margin

Gross profit measures the amount remaining after direct costs are deducted from revenue. Gross margin expresses that relationship as a percentage.

Example: If revenue is $100,000 and direct costs are $60,000, gross profit is $40,000 and gross margin is 40%.

A declining gross margin may indicate higher supplier costs, discounting, pricing pressure or changes in your sales mix.

Revenue Growth Can Hide Profit Problems

Revenue growth can create the appearance of stronger performance even when profitability is weakening.

  • Sales increase while gross margin declines.
  • Payroll grows faster than revenue.
  • Marketing costs rise without sufficient return.
  • Administrative expenses increase faster than operations.
  • Discounting reduces profit despite higher sales volume.
  • Debt and financing costs reduce net income.
Watch the relationship between revenue and expenses. Higher sales do not improve profitability when the cost of generating those sales increases faster than revenue.

Review Operating Expenses

Operating expenses should be reviewed for both total dollar movement and percentage of revenue.

  • Payroll and employee-related costs.
  • Rent and occupancy expenses.
  • Advertising and marketing.
  • Software and subscriptions.
  • Professional fees.
  • Insurance.
  • Travel and transportation.
  • Interest and financing costs.
  • Other recurring operating expenses.

Compare Results Over Time

A single month does not always provide enough context. Compare profitability across several periods to identify trends.

  • Current month versus prior month.
  • Current month versus the same month last year.
  • Year-to-date versus prior year-to-date.
  • Actual results versus budget.
  • Gross margin trends over time.
  • Net profit margin trends over time.

Profit and Cash Flow Are Different

A profitable business can still experience cash pressure. Customer collections, supplier payments, loan repayments, taxes and capital purchases affect cash differently from accounting profit.

For more detail, see Cash Flow Advisory for Small Businesses.

Which Ledger Pro Service Level Fits Your Business?

The level of support should reflect how much accounting work your business handles internally and how much financial analysis you need.

  • Routine accounting support: Accurate bookkeeping, reconciliations and financial records.
  • Accounting plus review: Periodic review of financial statements, margins and expense trends.
  • Advisory support: Deeper profitability analysis, forecasting, planning and ongoing financial guidance.

View Ledger Pro Plans & Pricing

What You Get With Ledger Pro

  • Experienced accounting support.
  • Review of reconciled financial information.
  • Analysis of revenue and expense trends.
  • Review of gross profit and net income.
  • Identification of unusual changes in margins.
  • Practical financial guidance based on your accounting information.

Start With Reliable QuickBooks Information

Profitability analysis depends on accurate accounting records. Unreconciled accounts, incorrect coding, duplicate transactions or outdated balances can distort revenue, expenses and profit.

Ledger Pro's QuickBooks review process helps identify areas requiring attention before relying on your financial statements for management decisions.

View the QBO Client Review Benchmark

Turn Profitability Information Into Action

Profitability analysis should lead to decisions. The results may support pricing changes, expense reductions, staffing adjustments, budget revisions or a closer review of products and services with weak margins.

Need help understanding your profitability? Ledger Pro provides remote accounting and advisory support designed around the financial needs of small businesses and organizations.

Contact Ledger Pro

Frequently Asked Questions

What is the difference between revenue and profit?

Revenue is the income generated from sales or services. Profit is what remains after the related costs and expenses are deducted.

What is gross profit margin?

Gross profit margin measures gross profit as a percentage of revenue. It helps show how much revenue remains after direct costs.

How often should profitability be reviewed?

Many active businesses benefit from monthly review. Quarterly review may be appropriate for smaller or less complex businesses.

Why can profit increase while cash decreases?

Profit and cash flow measure different things. Customer collections, debt payments, taxes, capital purchases and owner distributions can reduce cash even when the business reports a profit.

E-File Packages E-File Packages
Pricing & Packages View Pricing & Packages
About Me - Ledger Pro About Me
QuickBooks Payroll Certified ProAdvisor
error: Content is protected !!
Ledger Pro